Build Dashboards in Minutes With an AI Dashboard Generator
Discover how to use an AI dashboard generator to build production-ready internal tools from a simple prompt. Go from idea to deployed app in minutes.
By Suraj Ahmed
30th Jan 2026
Last updated: 30th Jan 2026
An AI dashboard generator is a pretty amazing tool. You give it a plain text description of what you want to see, and it builds a fully functional, interactive dashboard for you. It uses generative AI to handle everything—the user interface, the backend logic, even the data connections. This means people who aren't developers can create powerful internal tools in just a few minutes, not weeks.
Beyond Manual Dashboard Building
For years, building internal dashboards has been a massive bottleneck. I've seen it firsthand. The process was painfully slow, expensive, and you needed a specialized skillset, leaving teams stuck waiting for critical data insights.
Operations managers needed live inventory trackers yesterday. Finance leads were desperate for custom P&L reports. And startup founders? They simply couldn't afford the long development cycles. This old way of working created a frustrating gap between needing data and actually being able to act on it.
The traditional path meant choosing between rigid, complex BI tools like Tableau or piling more work onto already-overburdened engineering teams. Neither was a great option. BI platforms often required extensive training, while custom dev projects could drag on for months—by which time the original requirements had probably changed anyway.
The New Reality of AI-Driven Creation
An AI dashboard generator completely flips the script. Instead of wrestling with complicated software or writing code from scratch, you just describe the tool you need.
Let's say a product manager types, "Create a dashboard showing user sign-ups by cohort, with a line chart for daily trends and a table of the top 10 referring domains." The AI gets to work and builds a production-ready application. This cuts the time from idea to deployment down from weeks to minutes.
This isn't just a small improvement; it's a fundamental change in how teams get their hands on and visualize information. You can see this shift reflected in the market's explosive growth. The Generative AI in Data Visualization market was valued at USD 3.6 billion in 2023 and is projected to skyrocket to USD 10.8 billion by 2033. This growth is all about the demand for real-time, personalized dashboards that help teams make smarter decisions, faster. You can explore detailed market trends to see just how much AI is reshaping business intelligence.
This simple workflow really captures the essence of it: you provide a text prompt, the AI generates the application, and you get a working dashboard.
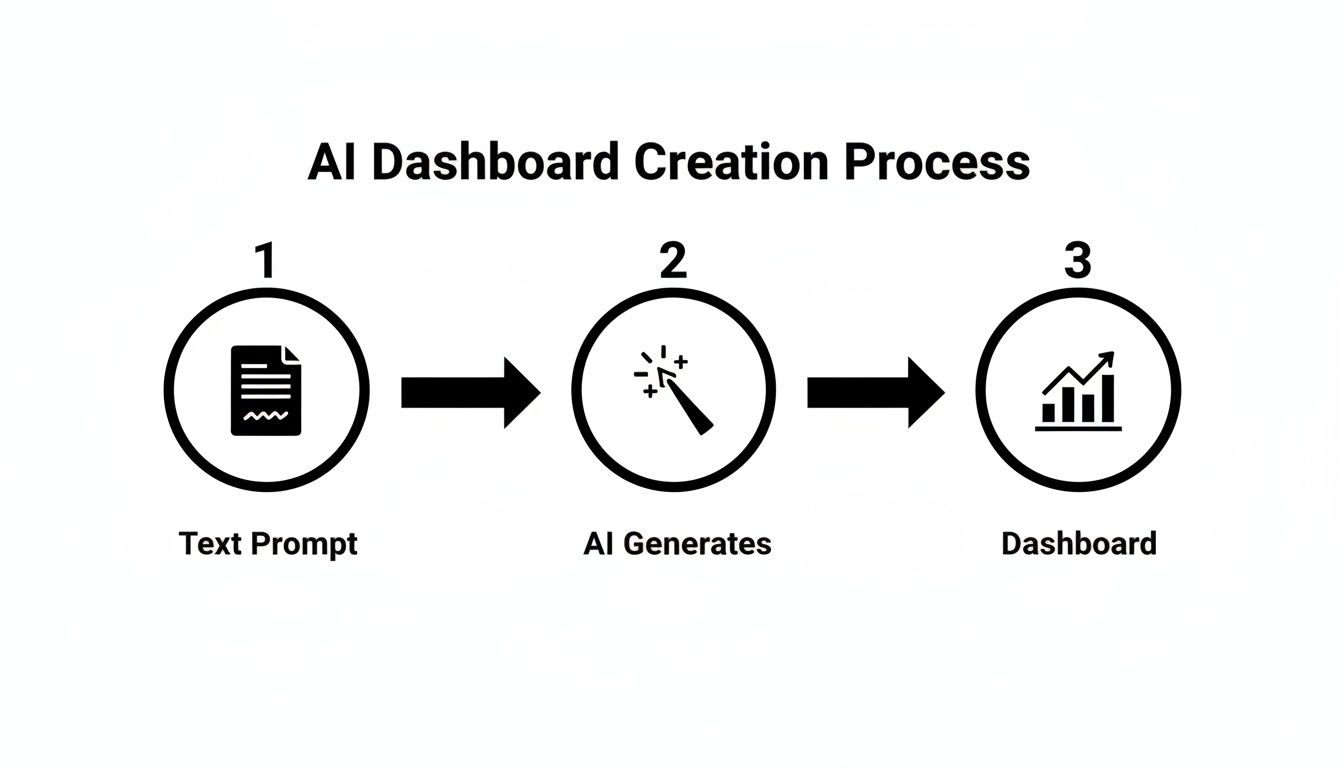
This three-step process makes building tools accessible to everyone. It puts the power directly into the hands of the people who actually need the data, no coding experience required.
Here’s a quick breakdown of how this new approach stacks up against the old way of doing things.
AI Generator vs Traditional BI Tools
| Feature | AI Dashboard Generator | Traditional BI Platform |
|---|---|---|
| Speed to First Value | Minutes to hours. Go from prompt to a live app quickly. | Days to weeks. Requires setup, schema design, and training. |
| Required Skillset | Anyone. If you can write an email, you can build a dashboard. | Specialists. Data analysts or BI experts are usually needed. |
| Flexibility | Highly flexible. Easily iterate and modify with new prompts. | Rigid. Changes often require complex configuration updates. |
| Cost | Lower upfront cost. Typically SaaS-based and more affordable. | High licensing fees. Often involves expensive per-user costs. |
| Collaboration | Built-in. Shareable links and real-time collaboration. | Often siloed. Sharing and exporting can be clunky. |
Ultimately, while traditional tools still have their place for deep-dive analytics, AI generators are unbeatable for quickly spinning up the custom, actionable dashboards that business teams need every day.
Crafting Your Perfect AI Prompt
The quality of your AI-generated dashboard hinges entirely on the quality of your prompt. Think of the AI not as a mind-reader, but as an incredibly fast junior developer who needs a clear, specific brief to do their best work. Learning to write a good prompt is the single most important skill you can develop to get a powerful, functional application from a single sentence.
This isn't about learning to code. It's about learning to communicate your vision effectively. A lazy prompt like "make a sales dashboard" will get you exactly what you asked for: a generic, unhelpful template. But a thoughtfully constructed prompt can produce a tool that feels like it was custom-built for your team's exact needs.
The good news? This is a skill anyone can learn. It really just comes down to breaking your request into four essential parts: what you're trying to achieve, what data you're using, what it should look like, and how it should behave. Once you get the hang of this, you’ll be building surprisingly sophisticated tools in just a few seconds.
The Anatomy of a Great AI Prompt
A really effective prompt is built on four pillars. Nail these, and the AI has all the context it needs to build what’s in your head, which saves you a ton of time editing and tweaking later.
Let's break them down.
- Define the Goal: Always start with the "why." What problem is this dashboard supposed to solve? Who is it for? Stating the core purpose upfront helps the AI make smarter choices about the layout and functionality.
- Specify Data Sources: You have to tell it where the data is coming from. Mention the tables (e.g.,
users,orders) and even the specific columns (e.g.,signup_date,order_value) you plan to use. This gives the AI a blueprint for creating the right queries. - Outline UI Components: Be explicit about the building blocks you want to see. Ask for a
line chart, atable, a fewKPI cards, or adate filter. The more descriptive you are here, the closer the first version will be to what you actually want. - Describe the Logic: This is where you explain how the pieces connect. "Show customer data" is okay, but it’s vague. "Display a table with the 10 most recent customers from the
userstable, showing columns for name, email, and signup_date" is infinitely better.
Pro Tip: My go-to advice is to write the prompt as if you're explaining the dashboard to a new hire. Use simple, direct language and avoid internal jargon if you can. The more context you give it, the less it has to guess.
This straightforward approach is completely changing how quickly businesses can build internal tools. AI-powered generators are part of a massive market shift—the closely related AI Document Generator market was valued at USD 13.6 billion in 2025 and is projected to explode to USD 77.4 billion by 2035. For founders and team leads, this means turning ideas into interactive tools almost instantly. You can find more insights on the growth of AI automation here.
Real-World Prompt Examples for Different Roles
Theory is great, but seeing actual prompts in action makes it all click. The secret is to tailor every prompt to a very specific business need. A generic request gets you a generic dashboard. A role-specific request gets you a solution.
To give you a head start, I've put together a few practical examples I've used in the past. Notice how each one hits on the four key components we just covered. You can copy these and adapt them for your own data.
Example AI Prompts for Different Roles
Here are a few copy-paste-ready templates designed for common business scenarios.
| Role | Use Case | Example Prompt |
|---|---|---|
| Operations Manager | Inventory Tracking | "Build an inventory management dashboard. Show KPI cards for 'Total Items in Stock,' 'Low Stock Alerts,' and 'Items Sold Today.' Include a table of all products from the inventory table with columns for product_name, SKU, quantity_on_hand, and supplier. Add a button on each row to 'Reorder Stock.'" |
| Finance Lead | P&L Monitoring | "Create a Profit & Loss dashboard. Display a bar chart showing 'Monthly Revenue vs. Expenses' from the financials table. Add KPI cards for 'Gross Profit,' 'Net Profit Margin,' and 'YTD Revenue.' Include a date range filter that applies to all components on the page." |
| Product Manager | User Engagement | "Generate a user engagement dashboard connected to our events table. I need a line chart showing 'Daily Active Users' over the last 30 days. Add a pie chart breaking down users by 'Subscription Tier.' Also, include a table of the 'Top 10 Most Used Features' based on event counts." |
| Developer | API Health Monitor | "Construct an API health monitoring tool. Show a status indicator ('Up' or 'Down') for each of our microservices: auth-service, payment-service, and user-service. Add a table that displays the 50 most recent API logs from the api_logs table, showing timestamp, endpoint, status_code, and response_time_ms." |
These prompts work so well because they are specific, action-oriented, and leave very little room for the AI to guess. They clearly state what to show and where to get the data. That’s the whole secret to getting a fantastic first draft from any ai dashboard generator.
Start with these templates, swap in your own table and column names, and see what you can build.
Getting Your Live Data Hooked Up

The dashboard your AI generated is a fantastic blueprint, but it doesn't become truly useful until it’s plugged into live data. This is the step where a cool-looking prototype transforms into a tool your team can actually rely on every single day.
Thankfully, you don't need to be a developer to make this happen. Modern platforms have done away with the need to write complex connection strings or wrestle with authentication protocols.
Instead, you’re usually just filling out a few fields in a secure form. An ai dashboard generator like FlyDash is built to handle the heavy lifting, giving you a straightforward interface to plug in your credentials. From there, the platform takes care of the rest.
This shift is huge. It means the people who know the data best—like an operations manager watching inventory or a finance lead tracking burn rate—can build their own tools without getting stuck in a long engineering queue. You’re essentially turning a static picture of your business into a living, breathing view.
Integrating with SQL Databases
For most companies, the crown jewels of their data reside in a SQL database. Getting your dashboard connected to sources like PostgreSQL or MySQL is often the first real task you'll tackle.
You'll typically head over to a "Data Sources" or "Integrations" section in the tool, pick your database type from a list, and then fill in the necessary credentials.
- Host: The address of your database server.
- Port: The port number your database uses.
- Database Name: The specific database you want to pull data from.
- Username & Password: Login credentials for your database user.
A Quick Security Tip: This is important. Always create a dedicated, read-only database user just for your dashboard. It's a simple but critical security practice that ensures your dashboard can only query data and can never accidentally change or delete anything in your production environment.
Once you’re connected, the dashboard generator can intelligently read your database schema. This makes it much easier to reference the right tables and columns when you start building out queries and fine-tuning your UI components.
Connecting to REST and GraphQL APIs
So much of a company's data doesn't live in its own databases anymore; it's spread across dozens of SaaS tools. We're talking payment info in Stripe, customer records in Salesforce, or project tickets in Jira. Tying all that information together in one place is where API integrations shine.
Connecting to a REST API, for instance, is usually as simple as providing a base URL and an API key for authentication.
Let's look at how this works in the real world.
Real-World Example An Ops Manager’s Inventory API
Imagine an Ops Manager needs to keep a constant eye on stock levels. The inventory is managed by a third-party logistics partner who provides a REST API. Here's how she could get a live view in minutes:
- Add a new data source: Inside the AI dashboard generator, she’d select "REST API" from the list of integration options.
- Plug in the credentials: She then enters the API’s base URL (something like
https://api.inventory-provider.com/v1) and securely pastes her secret API key into the authorization header field. - Define the query: Next, she creates a query to pull the product data. She’ll point it to the right endpoint (e.g.,
/products) and maybe add a parameter to only show items with low stock, like?stock_level=low. - Connect to the UI: The final step is linking that query to the table on her dashboard. She maps the
product_namedata from the API to the "Product Name" column and thequantity_on_handdata to the "Stock Level" column.
And just like that, without touching a line of code, she has a live-updating table that automatically flags which products need reordering. The same idea applies to GraphQL APIs, where you can write precise queries to get exactly the data you need without any extra baggage. This ability to pull from different systems is what makes these dashboards such a game-changer for day-to-day operations.
Refining and Collaborating on Your New App
The AI gets you about 90% of the way there, which is a massive head start. But that final 10% is where your team's expertise turns a good dashboard into a tool you can't live without. This isn't just about tweaking colors; it’s about dialing in the logic so it perfectly mirrors how your team actually works.
Think about a simple task list the AI might generate. It probably includes a button that says 'Mark as Complete.' That's fine, but what if your workflow is more complex? With a modern AI dashboard generator, you can pop open the code for that specific button. Instead of just updating a status, you could easily add a line of code to also send a project manager an email notification.
This ability to jump between a visual drag-and-drop editor and a full-on code editor is the secret sauce. You get the raw speed of AI generation without giving up the granular control you need for a production-ready app.
Adopting a Real-Time Collaborative Workflow
The real magic begins when you invite your team to the party. Gone are the days of endless email chains with screenshots and confusing feedback. Today's app builders have adopted a collaborative model that feels more like working in Google Docs or Figma.
Imagine this: a product manager, a designer, and a developer are all logged into the same dashboard at the same time. The PM is writing copy for a new KPI card, the designer is adjusting the layout on the fly, and the developer is optimizing a tricky SQL query. You can see each other's cursors moving in real time, making the whole iteration process incredibly fast and fluid.
This isn't just a nice-to-have feature; it's a core part of platforms like FlyDash, where teamwork is built right in.
Here’s a glimpse of what this multi-user, real-time editing looks like in action.

As you can see, multiple users are present with live cursors, all making changes in the same interface. This drastically cuts down on communication overhead and speeds everything up.
This approach does more than save time; it changes the dynamic between technical and non-technical team members. Everyone gets a seat at the table, contributing their expertise directly to the finished product.
This shift toward collaborative, AI-assisted development is part of a massive market trend. The Generative AI market is projected to explode from USD 22.21 billion in 2025 to an incredible USD 324.68 billion by 2033. This growth is fueled by tools that deliver real results, with some companies reporting up to 50% faster time-to-insight after adopting collaborative platforms. You can read the full research about Generative AI's market growth to see the data.
From Minor Tweaks to Major Logic Changes
Once your team is in the same workspace, you can move beyond small visual edits to make meaningful changes to the app's logic. This is where a flexible AI dashboard generator truly proves its worth.
Here are a few common refinement tasks that used to be a developer-only job but are now accessible to the whole team:
- Modifying a Button's Functionality: As mentioned, you can easily add actions. A single button click could update a database record and trigger a webhook to a Slack channel.
- Adding Custom Data Validation: Need to stop users from entering negative numbers in an inventory field? You can open the code for that input and add a simple validation rule in seconds.
- Customizing Chart Interactivity: The AI might give you a standard bar chart. You can then edit its properties so that clicking a bar instantly filters a nearby data table to show the underlying details.
- Implementing Role-Based Access Control: You can set rules to show or hide certain components based on a user's role. For example, a "Delete Record" button could be made visible only to users with an 'Admin' tag.
This level of control ensures the final dashboard isn't just a static report. It becomes a dynamic tool that actively supports your team's specific operational needs. The AI lays the foundation, but your team’s insights and collaboration build the tool you'll actually use every day.
Taking Your AI-Generated Dashboard Live
Getting your dashboard into the hands of users shouldn't be a nerve-wracking ordeal. You and your team have already done the hard work of refining the app. Now, it's time to move it from the development sandbox to a live production environment where it can start making an impact. This final push should be all about smooth transitions and ensuring you have complete ownership over what you’ve built.
The most important thing to remember here isn't just the deployment itself. It's about making sure you're not getting trapped in a proprietary system. A truly great AI dashboard generator is an accelerator, not a cage. The goal is to get clean, readable code that you can host anywhere you want.
Final Checks Before You Launch
Before you hit the big red "deploy" button, a quick quality assurance (QA) pass is absolutely crucial. This is your chance to catch any last-minute gremlins and ensure your users have a flawless experience from day one. Think of it as the final line of defense against a broken chart or a misleading metric.
Here’s what I always focus on:
- Data Connections: Are you sure the dashboard is pointing to the production database, not the staging one? It's a classic mistake. Double-check that all your database and API connections are stable and pulling in the right data.
- User Permissions: If you've set up different access levels, now's the time to test them. Log in as an "admin," a "viewer," and any other roles you have. Make sure everyone can see exactly what they're supposed to—and nothing more.
- Interactive Components: Get click-happy. Push every button, toggle every filter, and sort every table. Do all the UI elements respond correctly? Does the underlying logic fire as expected?
A quick sanity check can save you from a world of pain. I once burned an entire afternoon troubleshooting a live dashboard, only to find out the read-only database user's password had expired. A simple connection test would have caught it in seconds.
Escaping Vendor Lock-In: Why Code Export is Everything
This is what separates a serious professional tool from a toy. The best platforms, including FlyDash, don't just let you build a dashboard; they let you own it by exporting the entire application. We're not talking about a CSV file here—we're talking about the complete source code.
This means the AI is generating code using standard, popular technologies that any developer on your team can immediately understand and work with. Typically, you'll get:
- React or Vue.js for the frontend interface.
- Node.js or Python for the backend logic and server.
Having this code base is liberating. You can check it into your company's private Git repository, run it on your own infrastructure, and tweak it however you need to, completely free from the platform that generated it.
From AI to the Cloud: Connecting Git and Deploying
Once you have the source code, deploying it is a pretty standard affair. The first step is to connect your new dashboard project to a Git repository, whether that's on GitHub, GitLab, or another service. This gives you version control and a single source of truth for your app's code.
From there, pushing it to a modern cloud provider is surprisingly simple. Platforms like Vercel, Netlify, or AWS Amplify are purpose-built for this kind of workflow.
The process almost always follows these three steps:
- Link Your Git Repo: Inside your cloud provider's dashboard (like Vercel), you'll grant access to your GitHub account and simply select the repository where your dashboard's code lives.
- Configure the Build: The platform is usually smart enough to detect that it's a React or Node.js project and will suggest the right build commands. Your main job here is to plug in your environment variables—things like database credentials and API keys.
- Deploy: With the configuration saved, you just click "Deploy." The service takes over, pulling your code, building the application, and launching it on a global content delivery network (CDN). You'll often have a live URL in less than a minute.
This approach lets you use the AI dashboard generator for what it’s best at: knocking out the first 95% of the work with incredible speed. You take the high-quality, standard code it produces and manage its lifecycle with the same professional tools your dev team already knows and loves. It’s the perfect mix of AI velocity and human control.
Common Questions About AI Dashboard Generators
When you're looking at any new technology, especially one that plugs right into your business data, it's smart to ask a few tough questions. An AI dashboard generator can feel like a black box at first, so let's pull back the curtain and address the things that are probably on your mind.
Getting these concerns sorted out upfront is the key to building with confidence. We'll walk through everything from data security to what happens when the AI's first attempt isn't quite right.
How Secure Is My Data When I Connect It?
This is, without a doubt, the most important question and should be the first one you ask. Giving any tool access to your database requires a serious level of trust, and top-tier platforms are built with security as their foundation.
When you connect a data source, your credentials should be stored using industry-best encryption, like AES-256, ensuring they’re protected both in transit and at rest. A crucial point here is that the platform itself doesn't actually store your business data. It simply runs the specific queries needed to fetch information for your dashboard's charts and tables.
Based on my experience setting these up, here are a few best practices you should always follow for an extra layer of protection:
- Create a Read-Only User: This is non-negotiable. Before you connect your database, set up a dedicated user account with read-only permissions. This is a simple but powerful step that guarantees the dashboard can only fetch data, never modify or delete it.
- Use an SSH Tunnel: For sensitive production environments, look for tools that offer secure SSH tunneling. This creates a fully encrypted channel between the platform and your database, closing off potential vulnerabilities.
- Look for On-Premise Options: If your organization has strict data governance policies, find a generator that offers on-premise or VPC (Virtual Private Cloud) deployment. This keeps every part of the connection and the dashboard itself inside your own network.
What if the AI Doesn't Generate Exactly What I Need?
It's really important to have the right mindset here. The AI's first pass is almost never the finished product.
Think of it as an incredibly fast and capable junior developer building your first draft. It gets you 90% of the way there in a matter of seconds, which is a massive head start.
When that first version isn't perfect—and it won't be—you have a couple of great ways to refine it.
First, you can just talk to the AI again. Iterate on your prompt. If the dashboard is missing a chart or a filter, you just need to be more specific. For example, instead of just "show sales data," you could refine it to "show monthly sales revenue in a bar chart, with a dropdown to filter by sales region."
Second, and this is where the real power lies, you can pop open the editor. A good AI generator isn't a locked box; it gives you full access to a visual editor and the underlying code. You can drag and drop components, resize elements, and, most importantly, tweak the generated frontend and backend code directly. It’s the perfect mix of AI speed and human precision.
Can I Export the Code and Host the Dashboard Myself?
Yes, and you should consider this a deal-breaker. The whole point of these tools is to be an accelerator, not a walled garden. You should never, ever be locked into a proprietary platform.
The best AI dashboard generators, like FlyDash, let you export the entire application as clean, human-readable code. Typically, this package includes:
- A React codebase for the frontend UI.
- A Node.js application for the backend server logic.
This is huge because it gives you total ownership. You can check the code into your team's GitHub or GitLab, run it locally on your machine, and deploy it to any cloud provider you want, from Vercel to AWS. The AI helps you build, but you always stay in the driver's seat.
What Kinds of Data Sources Can I Connect?
For any internal tool to be worth its salt, it has to connect to where your data actually lives. A dashboard that can only talk to one type of database isn't going to cut it.
Thankfully, most quality generators support a wide and growing list of sources. You should expect to be able to connect to:
- SQL Databases: This is table stakes. Support for PostgreSQL, MySQL, MS SQL, and others is standard.
- Third-Party REST APIs: This is where you can pull in data from the SaaS tools you already use, like Salesforce for CRM data, Stripe for payments, or Jira for project tickets.
- GraphQL APIs: If your stack uses GraphQL, you can write precise queries to fetch exactly the data you need without over-fetching.
- Data Warehouses: For more heavy-duty analytics, you'll often find connectors for giants like BigQuery, Snowflake, and Redshift.
The connection process is usually straightforward, involving a secure form to enter your credentials or API keys. From there, you're ready to start writing queries and telling the AI how to visualize the data.
Ready to stop waiting and start building? With FlyDash, you can turn a simple text prompt into a production-ready dashboard in minutes. Connect your data, collaborate with your team in real time, and deploy anywhere. Start building for free at flydash.io and see how fast your ideas can come to life.
Ready to Build Your App?
Turn your idea into a production-ready React Native app in minutes.
Free tools to get you started
Free AI PRD Generator
Generate a professional product requirements document in seconds. Describe your product idea and get a complete, structured PRD instantly.
Try it freeFree AI App Name Generator
Generate unique, brandable app name ideas with AI. Get creative name suggestions with taglines, brand colors, and monogram previews.
Try it freeFree AI App Icon Generator
Generate beautiful, professional app icons with AI. Describe your app and get multiple icon variations in different styles, ready for App Store and Google Play.
Try it freeFrequently Asked Questions
RapidNative is an AI-powered mobile app builder. Describe the app you want in plain English and RapidNative generates real, production-ready React Native screens you can preview, edit, and publish to the App Store or Google Play.